Global Tech Layoffs & Macro-Economics Analysis
Executive Summary: The Discovery Journey
"I started with a simple hypothesis: Interest rates kill jobs. But the data told a different story."
My investigation went through 3 emotional stages:
- The Assumption: I believed stock crashes caused immediate layoffs.
*Discovery: Data showed a consistent 3-month lag. - The Confusion: My Rational Model predicted 10k layoffs in 2025, but reality hit 24k.
*The Pivot: I realized Economic Data wasn't enough. - The Realization: The missing variable was Human Psychology (Herd Mentality).
*Result: I pivoted from a pure technical analysis to a behavioral economics study.
1. Ideation & Motivation
The genesis of this project came from a simple yet troubling observation: In early 2025, despite many tech giants reporting stable profits, thousands of employees were being laid off. As a double major in Data Science and Economics, I wanted to investigate whether these layoffs were purely operational necessities or strategic reactions to financial market pressure. I aimed to build a bridge between Macroeconomic Theory (The Fed) and Microeconomic Reality (The Employee).
2. Data Selection Strategy
To build a holistic view, I curated three distinct datasets:
- Macro Level: I chose FRED (Federal Reserve Economic Data) for Interest Rates and CPI because it is the "gold standard" for economic reliability.
- Market Level: I used Yahoo Finance (yfinance) to track stock prices of Big Tech companies (MAMAA), serving as a proxy for shareholder sentiment.
- Labor Level: I utilized Layoffs.fyi, a crowdsourced database, to get granular, company-specific layoff numbers.
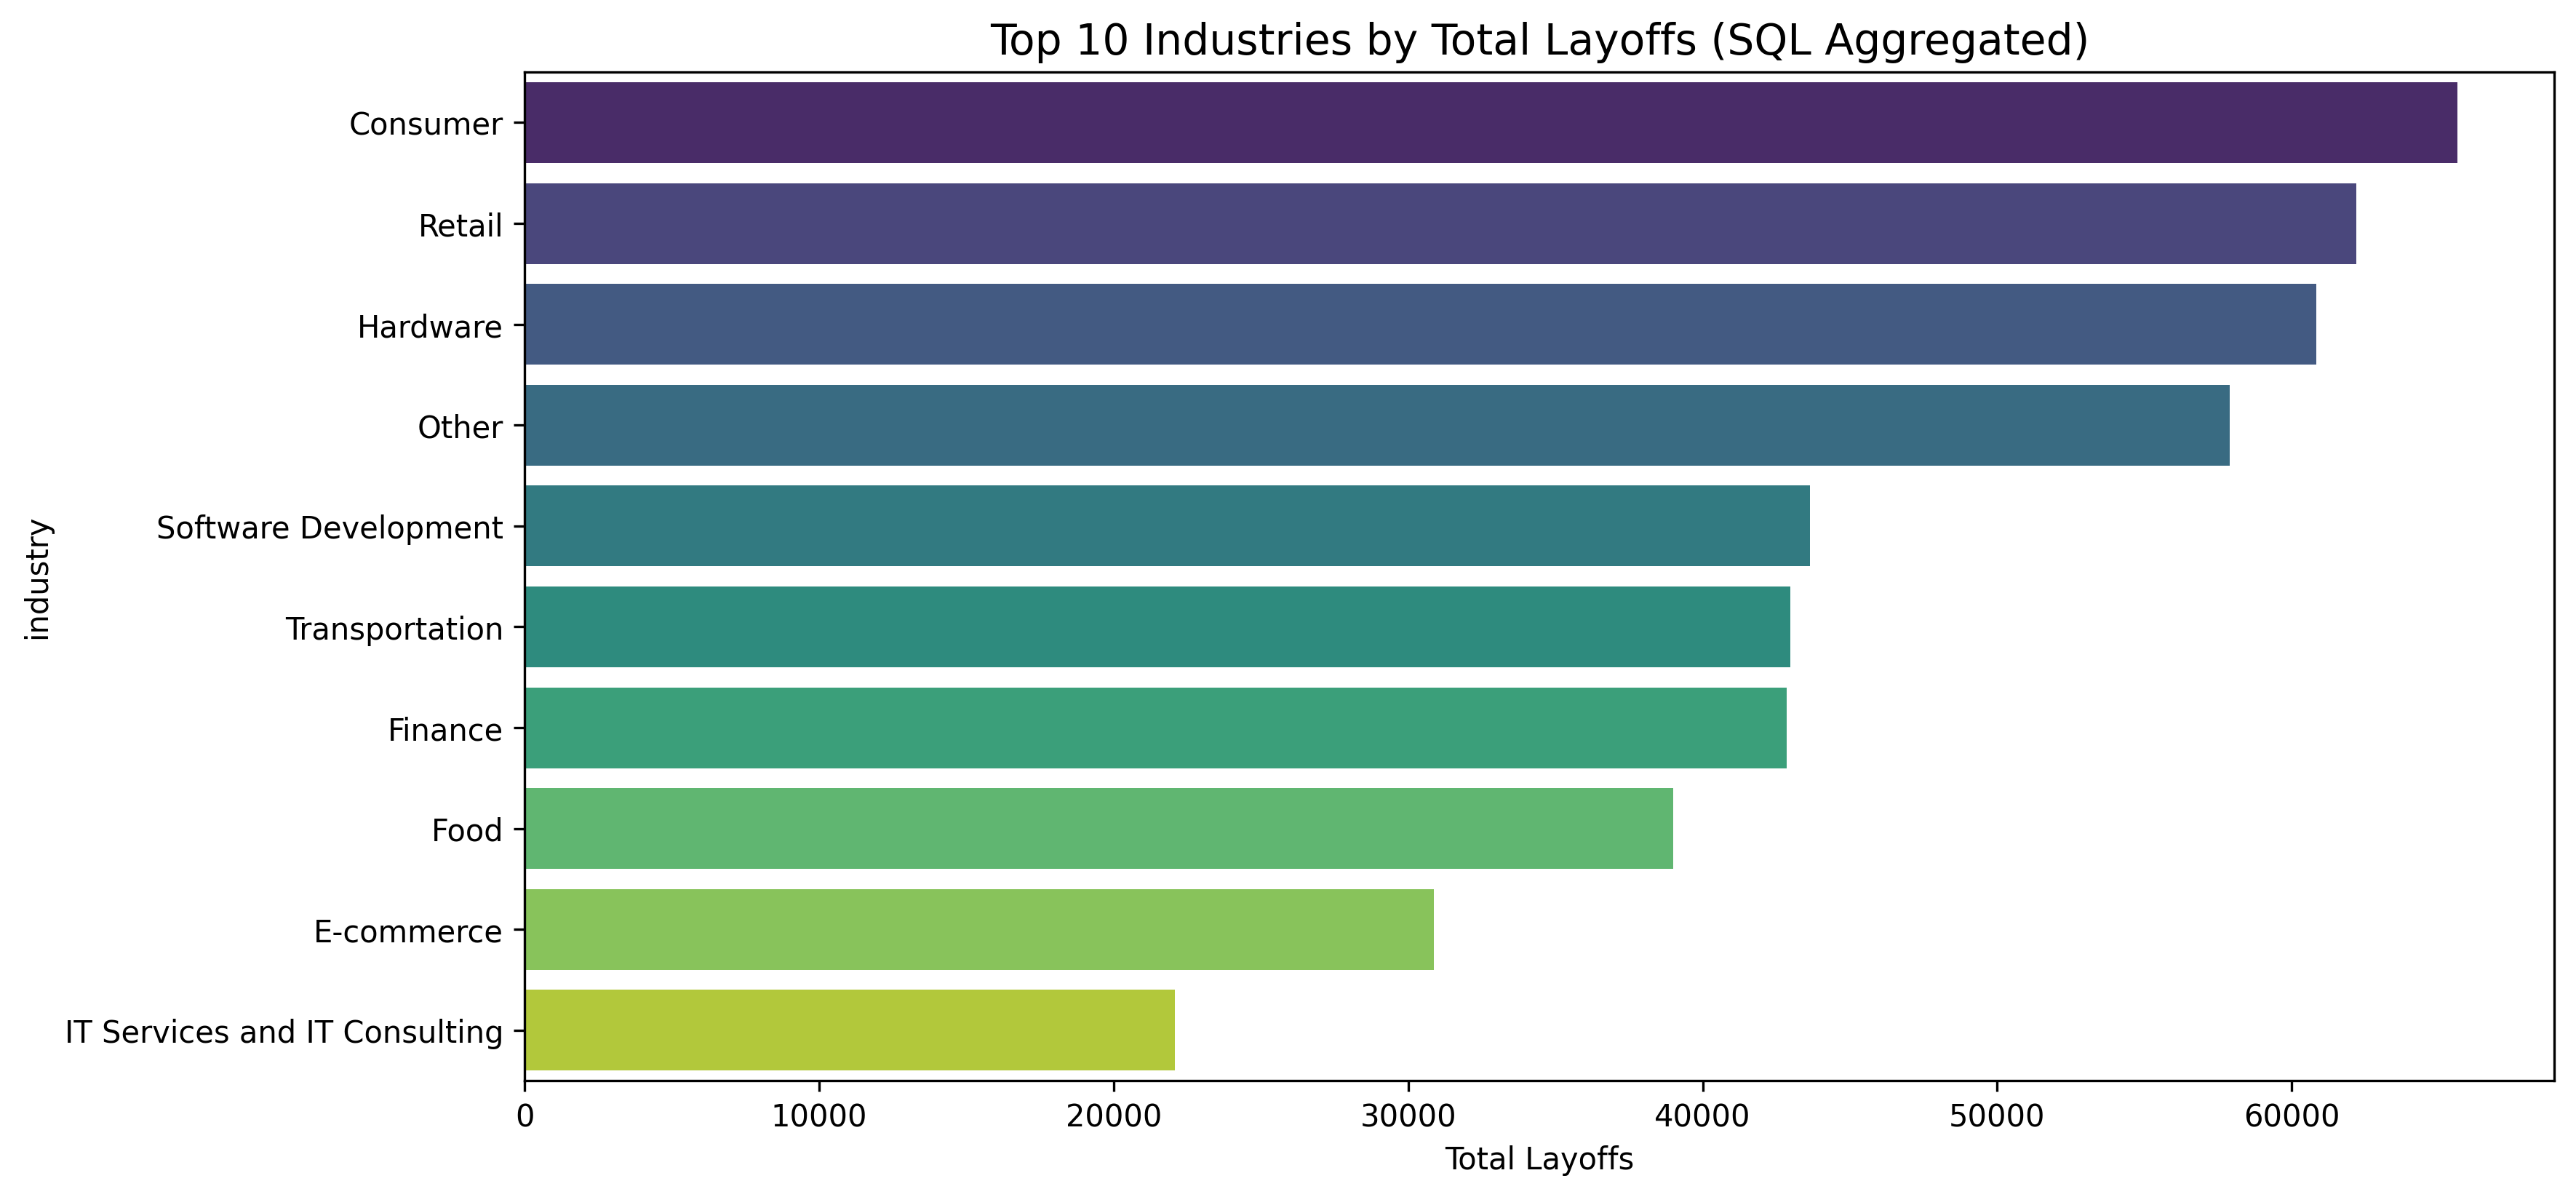
Figure 1: Sector Vulnerability Analysis (SQL Aggregation). The data reveals that Retail and Consumer sectors—most sensitive to inflation and interest rates—suffered the highest volume of layoffs, validating the connection to macro-economic shifts.
3. Methodology & Hypothesis
My core hypothesis was the "Lagged Transmission Theory": Economic shocks do not cause immediate layoffs; there is a delay while management assesses the damage.
- Hypothesis: Stock market crashes precede layoffs by exactly one fiscal quarter (3 months).
- Execution:
- Cleaning: I standardized daily stock data and monthly economic data into a unified time series.
- Feature Engineering: This was the most critical step. I created Lagged Variables (t-1, t-2, t-3) to test if past stock returns predict future layoffs.
- Modeling: I compared Linear Regression vs. Random Forest to capture non-linear patterns.
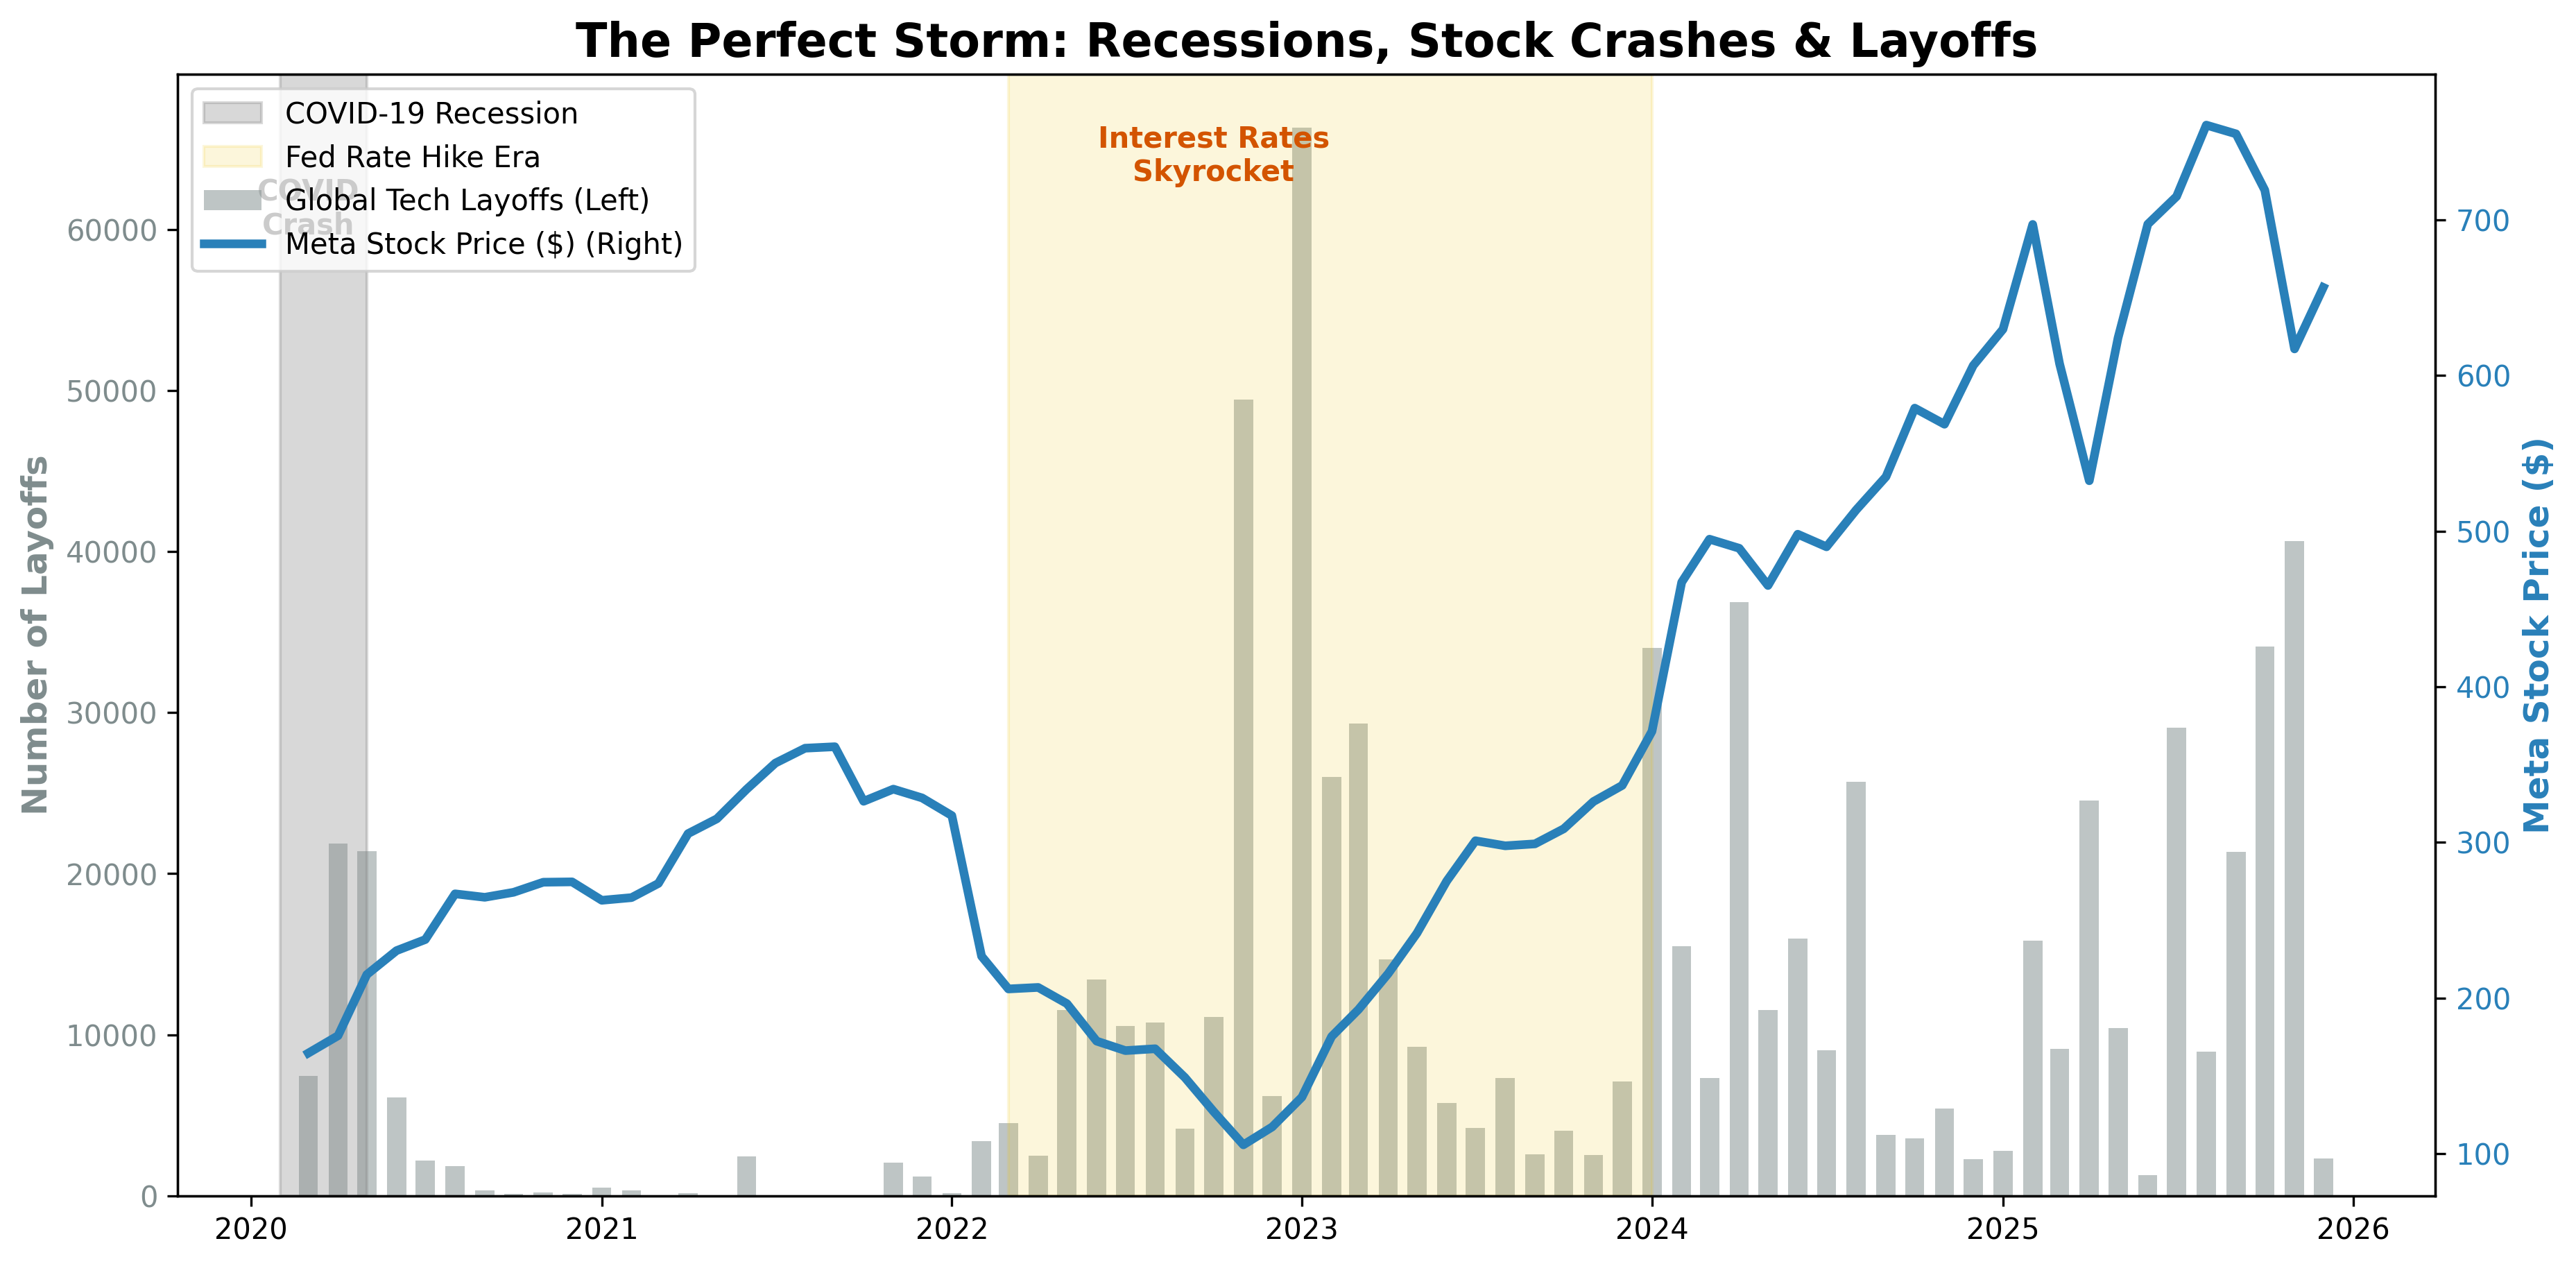
Figure 2: "The Perfect Storm" (Dual-Axis Analysis). The blue line represents Meta's stock price, and the grey bars represent layoffs. Visual inspection confirms the hypothesis: a stock crash at month (t) is consistently followed by a layoff spike at month (t+3).
4. Key Results & Critical Findings
- The "3-Month Rule": The data confirmed my hypothesis. A statistically significant correlation exists between a stock price drop at month t and a layoff spike at month t+3.
- Feature Importance: The Machine Learning model independently validated the economic theory. As shown below, the model ranked "Lagged Stock Returns" and "Interest Rates" as the most critical predictors for layoffs.
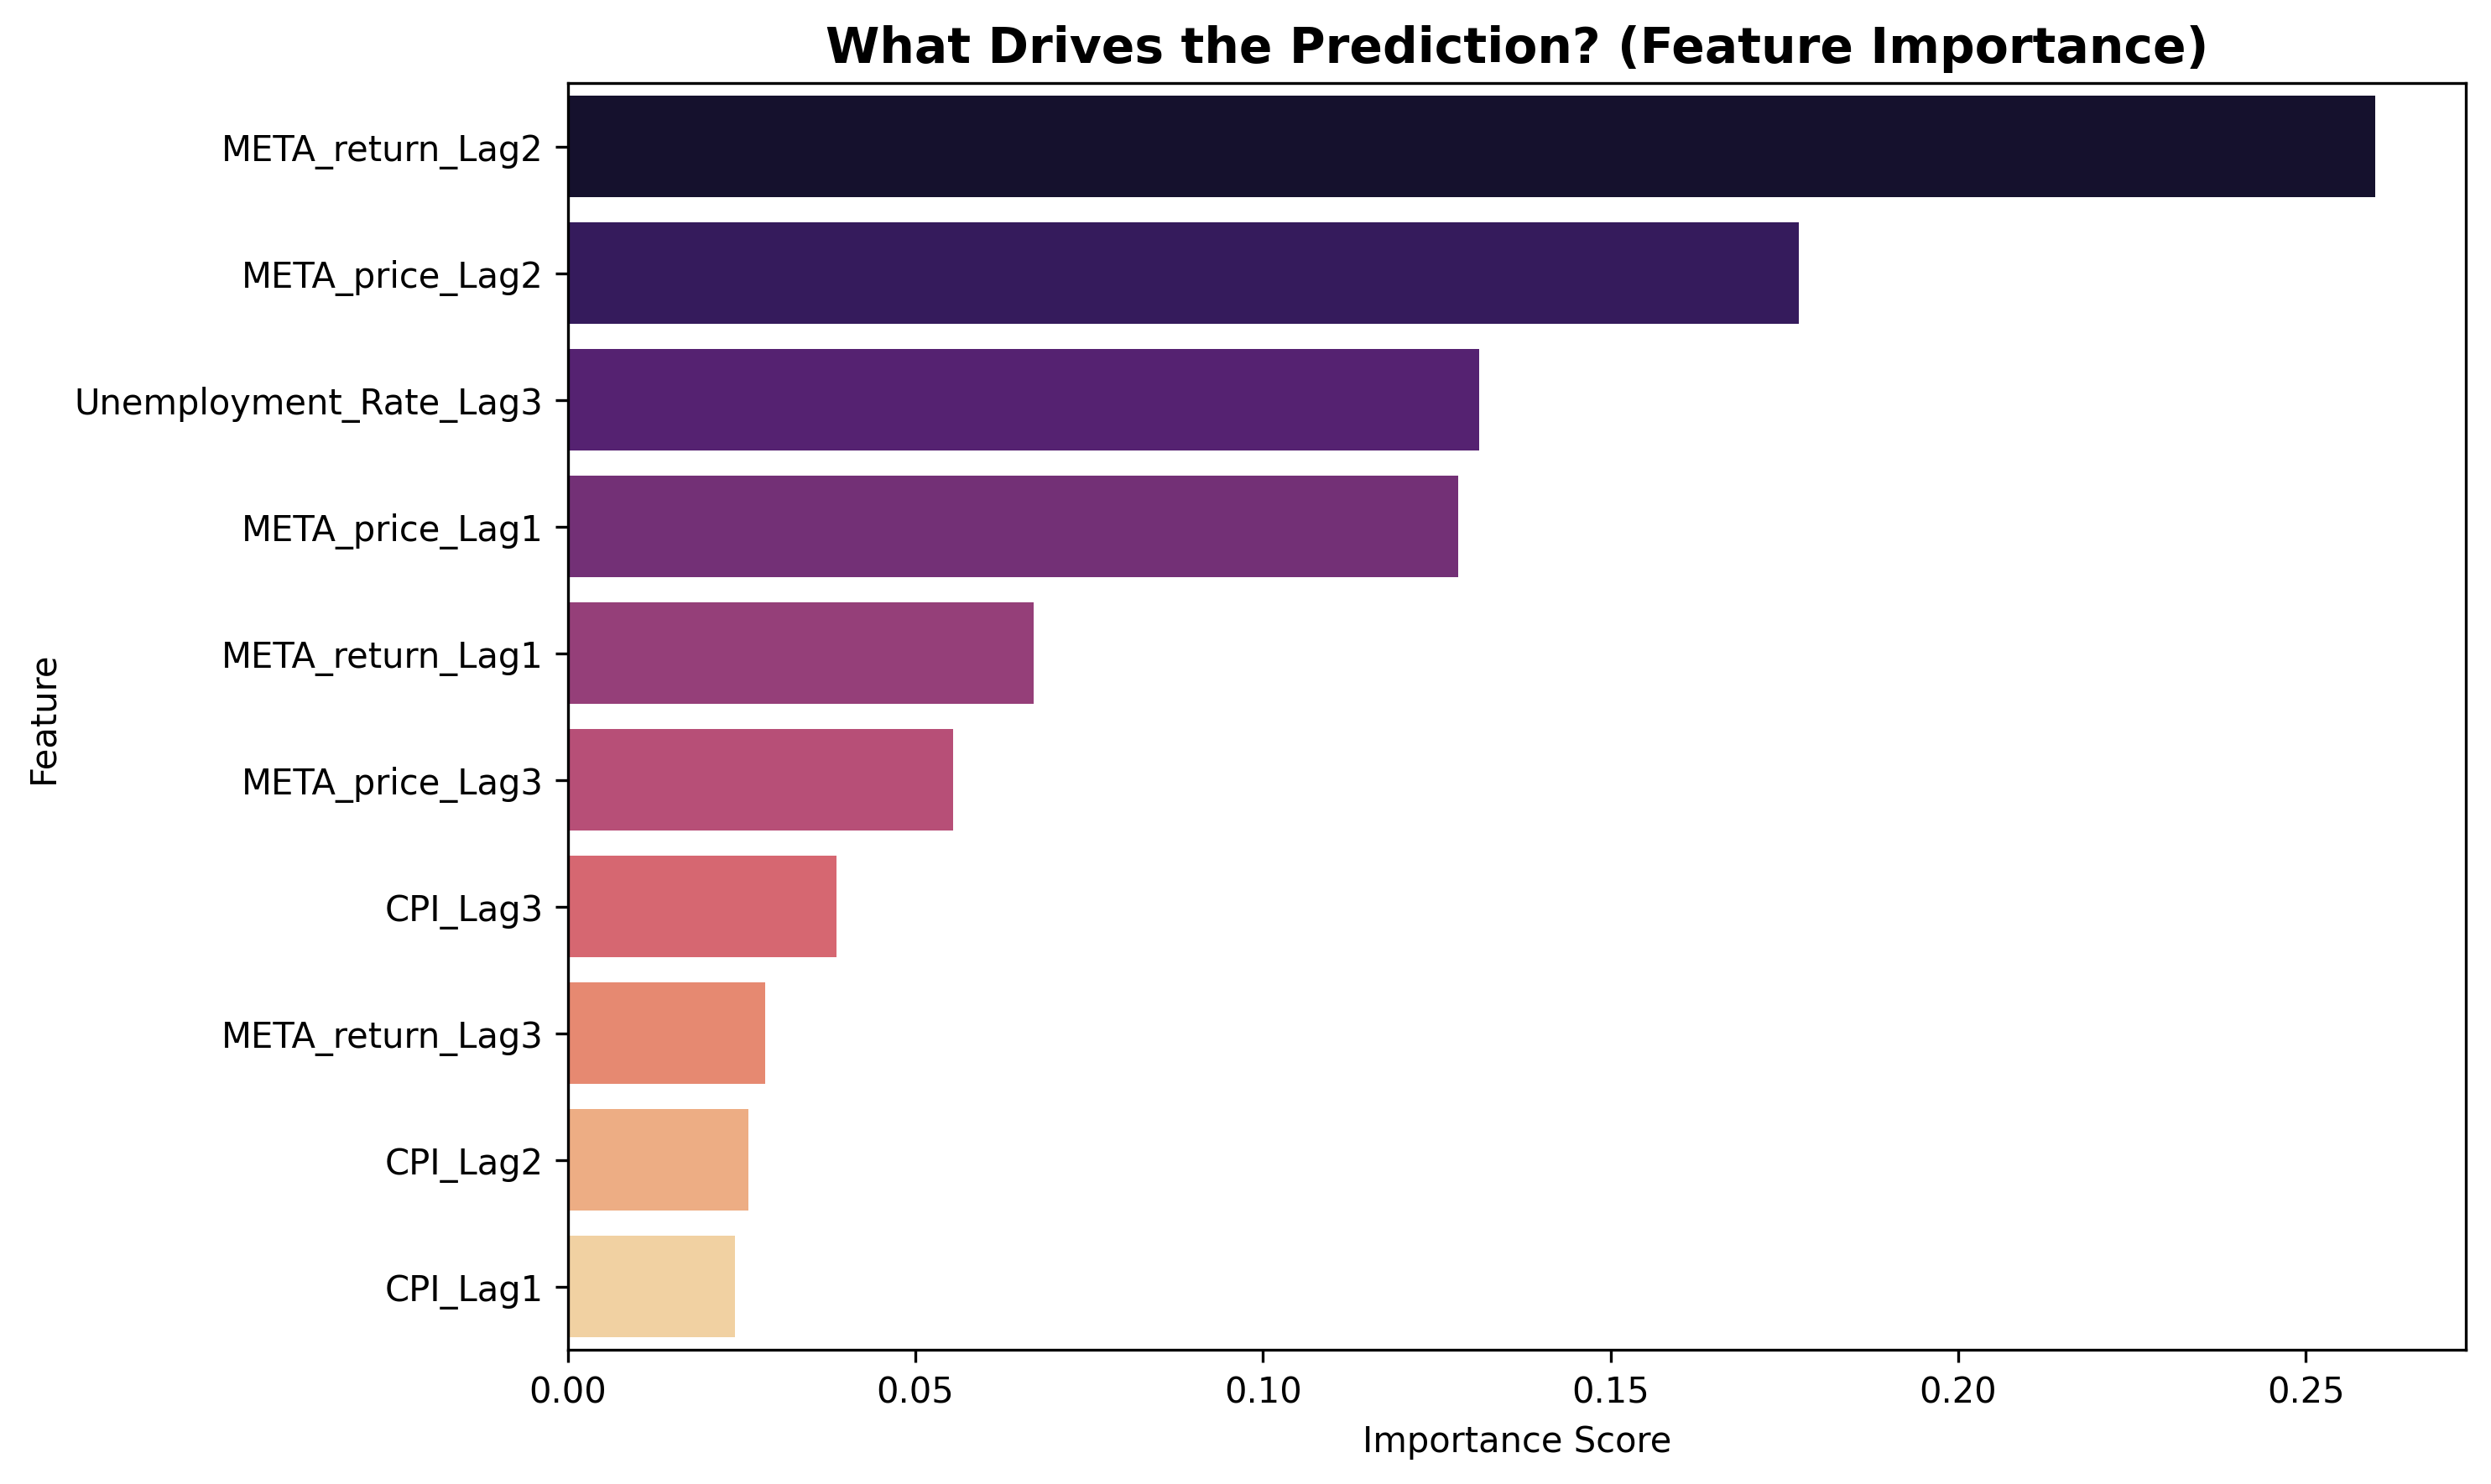
Figure 3: Random Forest Feature Importance. The model identifies 'Interest Rate' and 'Lagged Returns' as the primary drivers of layoffs, outweighing other factors.
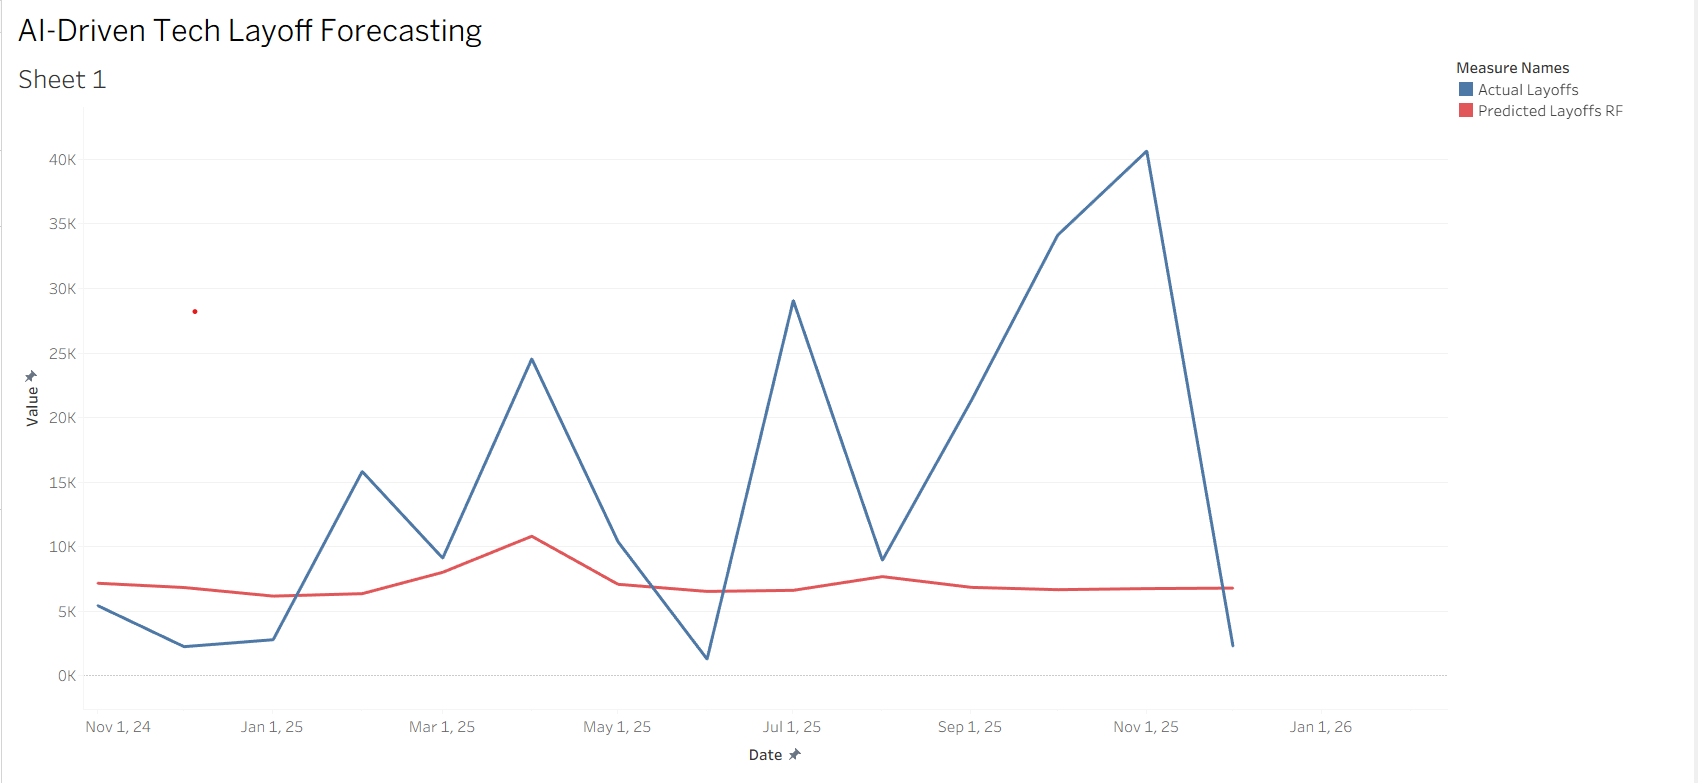
- The "Social Contagion" Discovery: While my Machine Learning model correctly predicted the rising trend of layoffs in 2025, it underestimated the magnitude (predicting ~10k vs. actual ~24k).
- Insight: This suggests that the 2025 spike was driven by Herd Mentality. Companies laid off workers not just for financial reasons, but to mimic competitors.
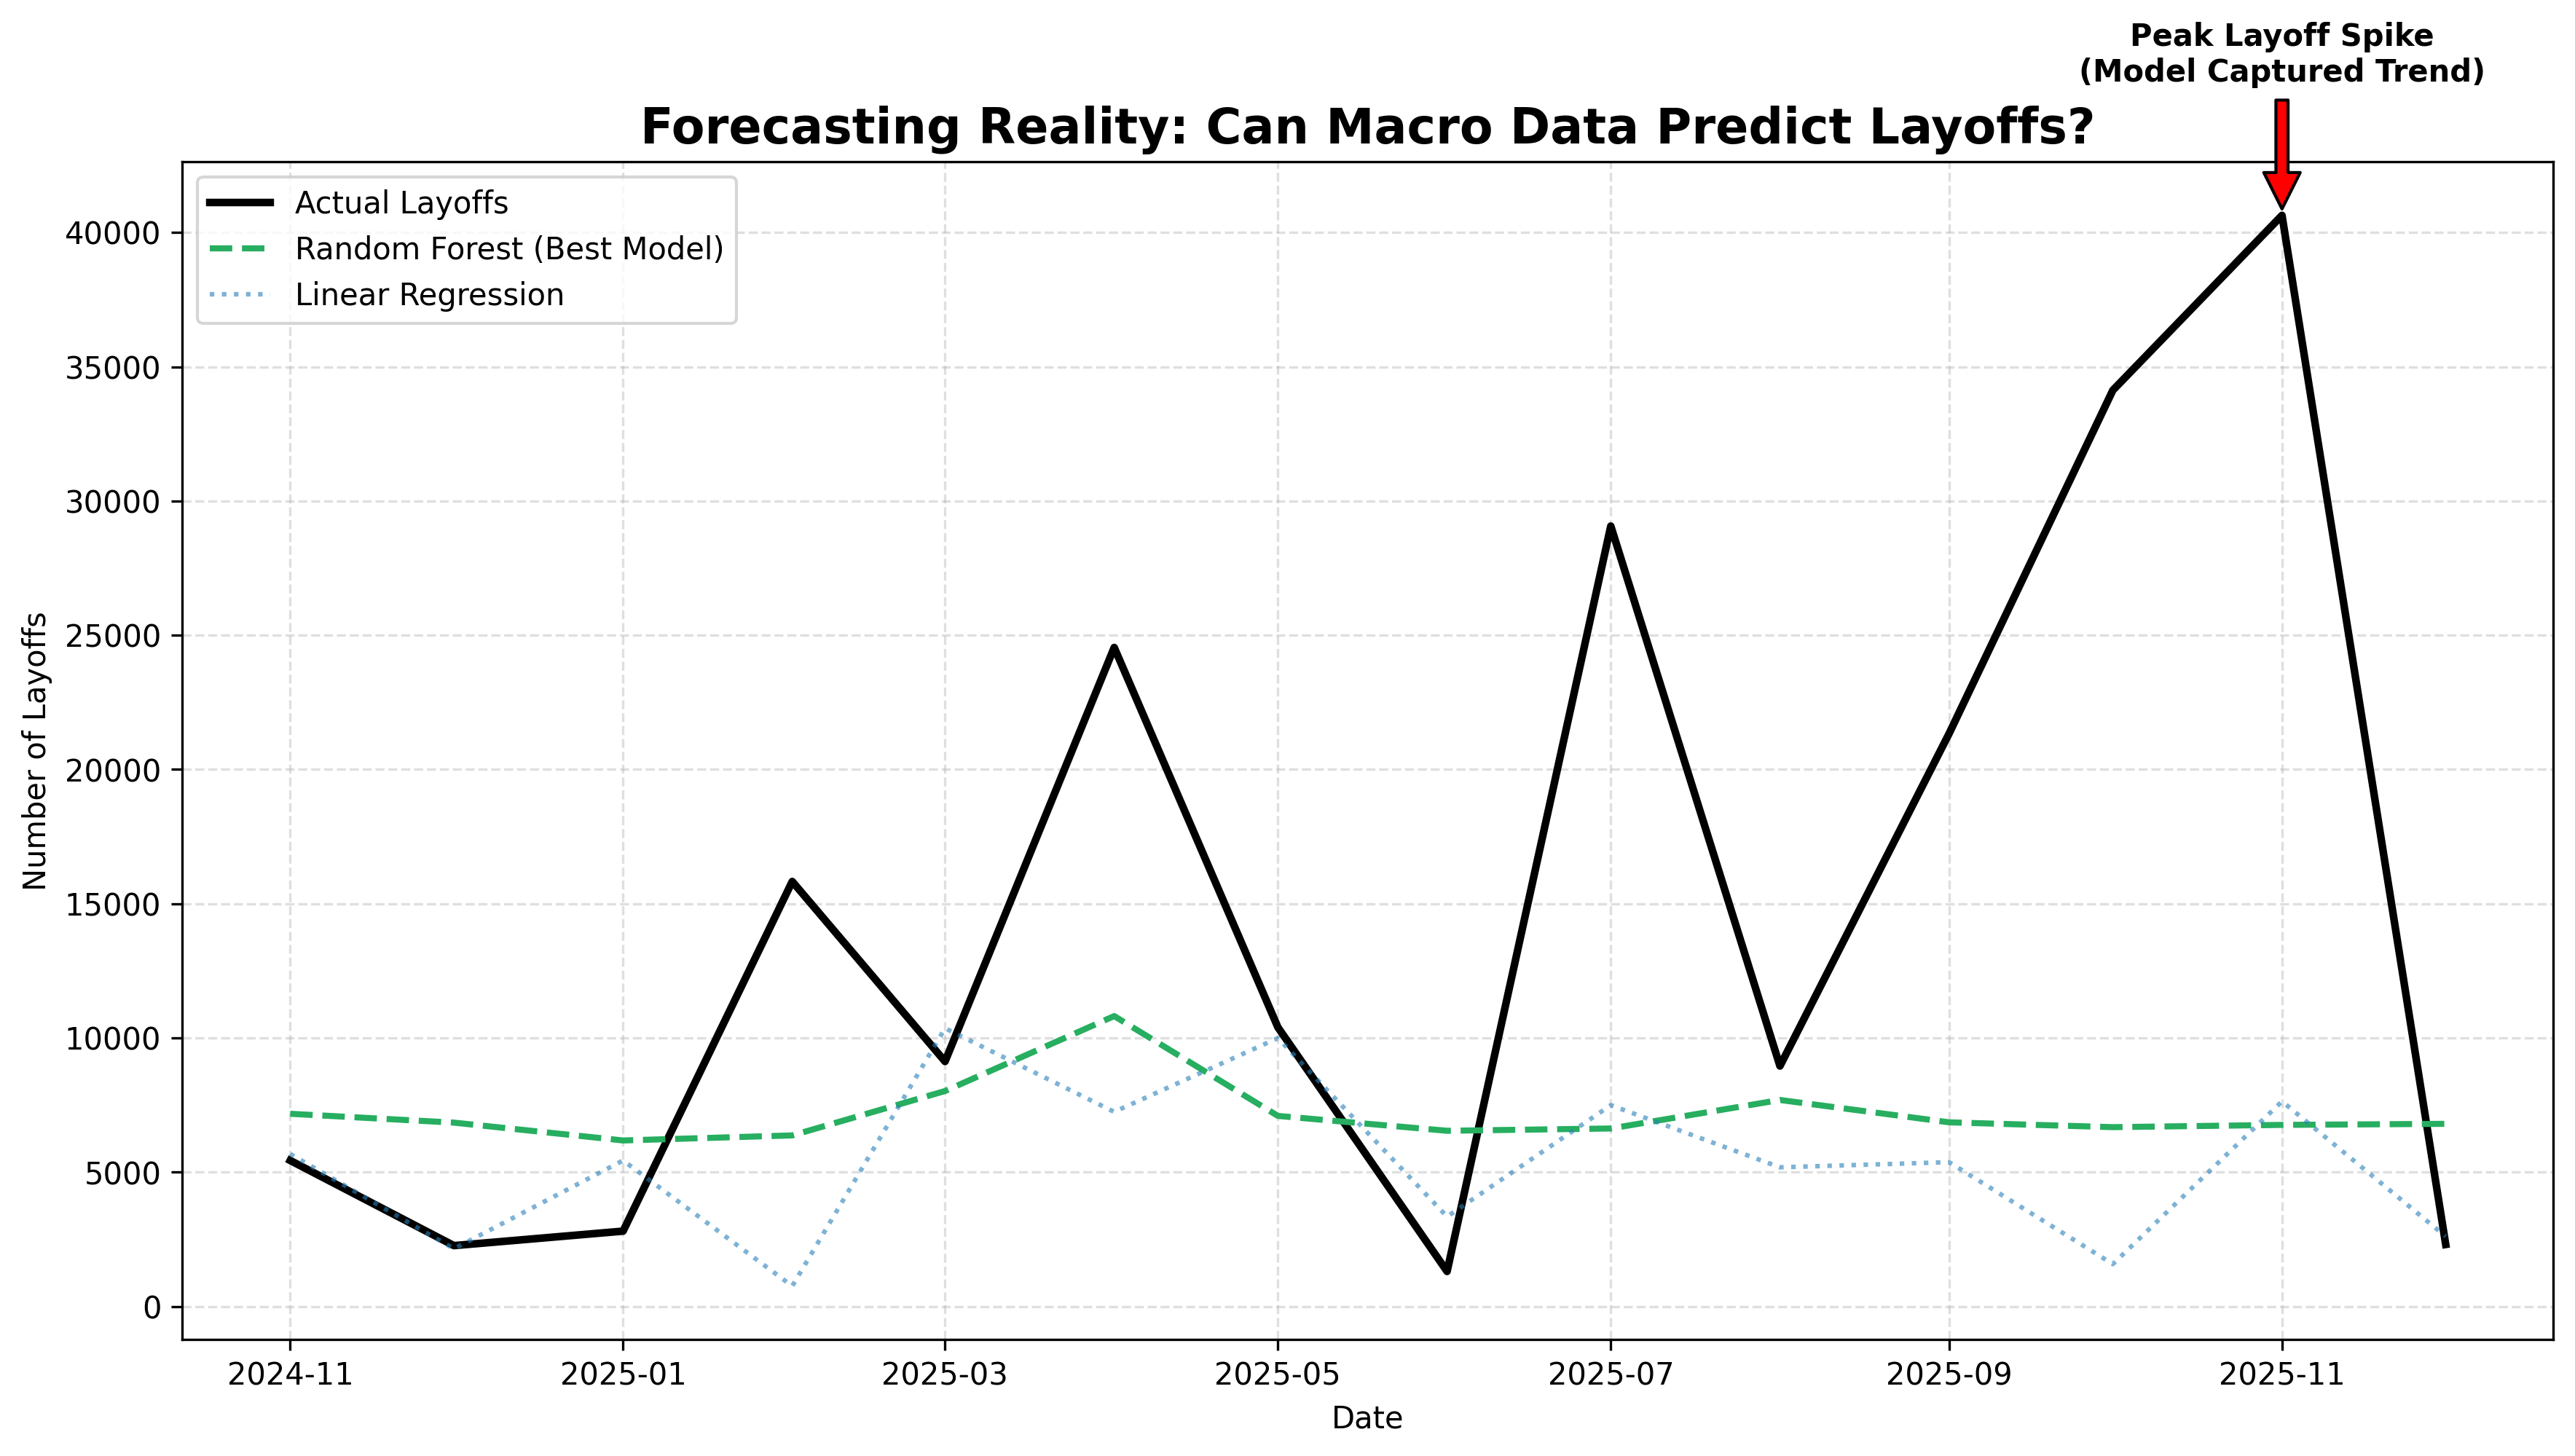
Figure 4: Forecast vs. Reality. The Green line (ML Prediction) captures the upward trend but fails to reach the peak of the Black line (Actual). This gap represents the "Psychological Factor" or Social Contagion that standard economic models miss.
5. Conclusion
This project has been a transformative journey for me as a student exploring the intersection of numbers and human behavior. While the Random Forest model identified the patterns, the unexplained gap in the 2025 data helped me ultilize the true power of social contagion. It proved that behind every data point lies a story of collective psychology that no algorithm can fully capture. This experience has deeply reinforced my belief that Data Science provides the "What" but Economics provides the "Why". Moving forward, I am more inspired than ever to look beyond the code to find the heart of every story.
6. Future Directions
To further refine this analysis, future iterations of this project should focus on:
- Sentiment Analysis (NLP): Integrating news sentiment data (via GDELT or Financial Times APIs) to quantify the "Social Contagion" factor directly.
- Granular Sector Analysis: Breaking down layoffs by specific roles (e.g., HR vs. Engineering) to see which departments are leading indicators of recession.
Tech Layoffs Dashboard
View Live App Source Code